

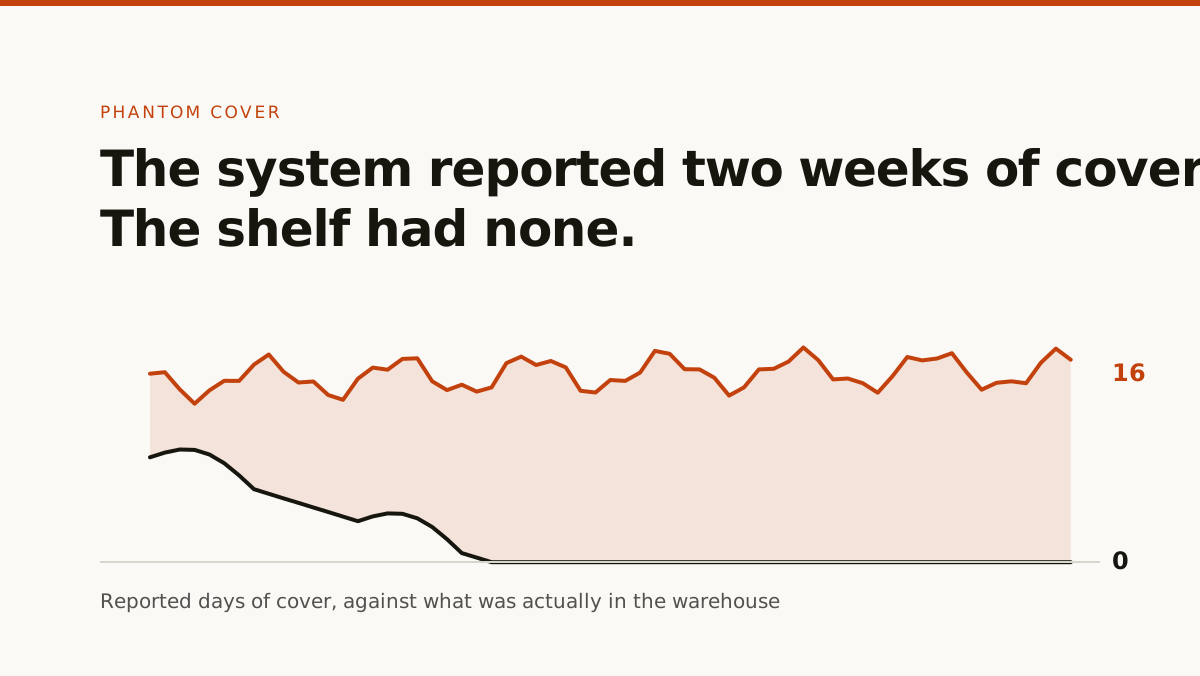
Somewhere in your catalog right now there’s a product that isn’t on the shelf, and a screen that says it is.
Nobody entered bad data. No integration broke. The purchase orders went out on schedule, got approved, and are sitting in the system exactly where they should be. The replenishment engine looked at the numbers this morning, decided there was plenty of cover, and didn’t raise a new order.
It’ll make the same decision tomorrow.
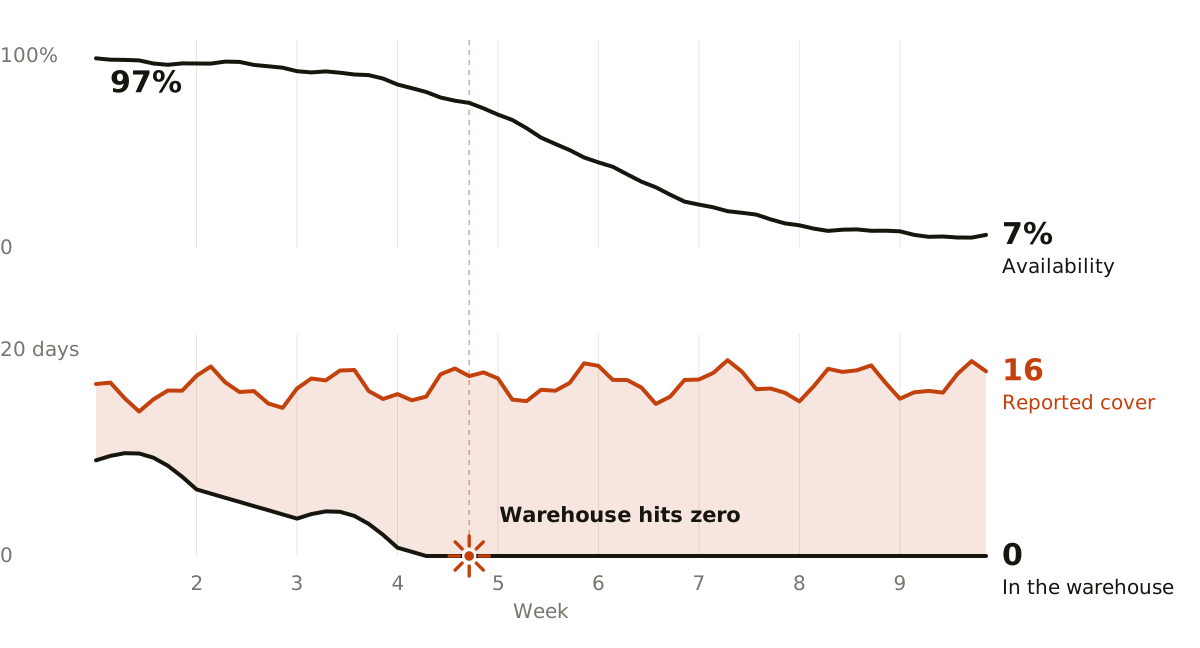
Meanwhile the item has been unavailable for five weeks. Forty-two of the forty-three days we looked at, the warehouse had none of it. Not low. None.
We see this often enough that it deserves a name. The literature calls it phantom inventory. We call this particular flavor of it phantom cover: stock that exists in the arithmetic and nowhere else.
Your system trusts your vendor more than you do
Days of cover is a simple idea. Take the stock you have, divide by daily demand, and you get the number of days before you run out. Every replenishment system in the category uses some version of it to decide when to order.
The trouble is the first term.
“Stock you have” almost always includes stock in transit, and reasonably so. Goods on a truck will be on a shelf in two days, and a system that ignored them would order twice what it needs. But in-transit isn’t a measurement. It’s an inference from a purchase order. The system knows what was ordered, and assumes it’s coming.
That assumption is the whole problem. When a vendor stops delivering, it quietly becomes fiction. The orders keep going out. Each one adds to in-transit. None of them arrive. In-transit climbs, days of cover holds steady or even improves, and the engine concludes everything is under control while the warehouse runs down to zero and stays there.
The worse the vendor performs, the healthier the number looks.
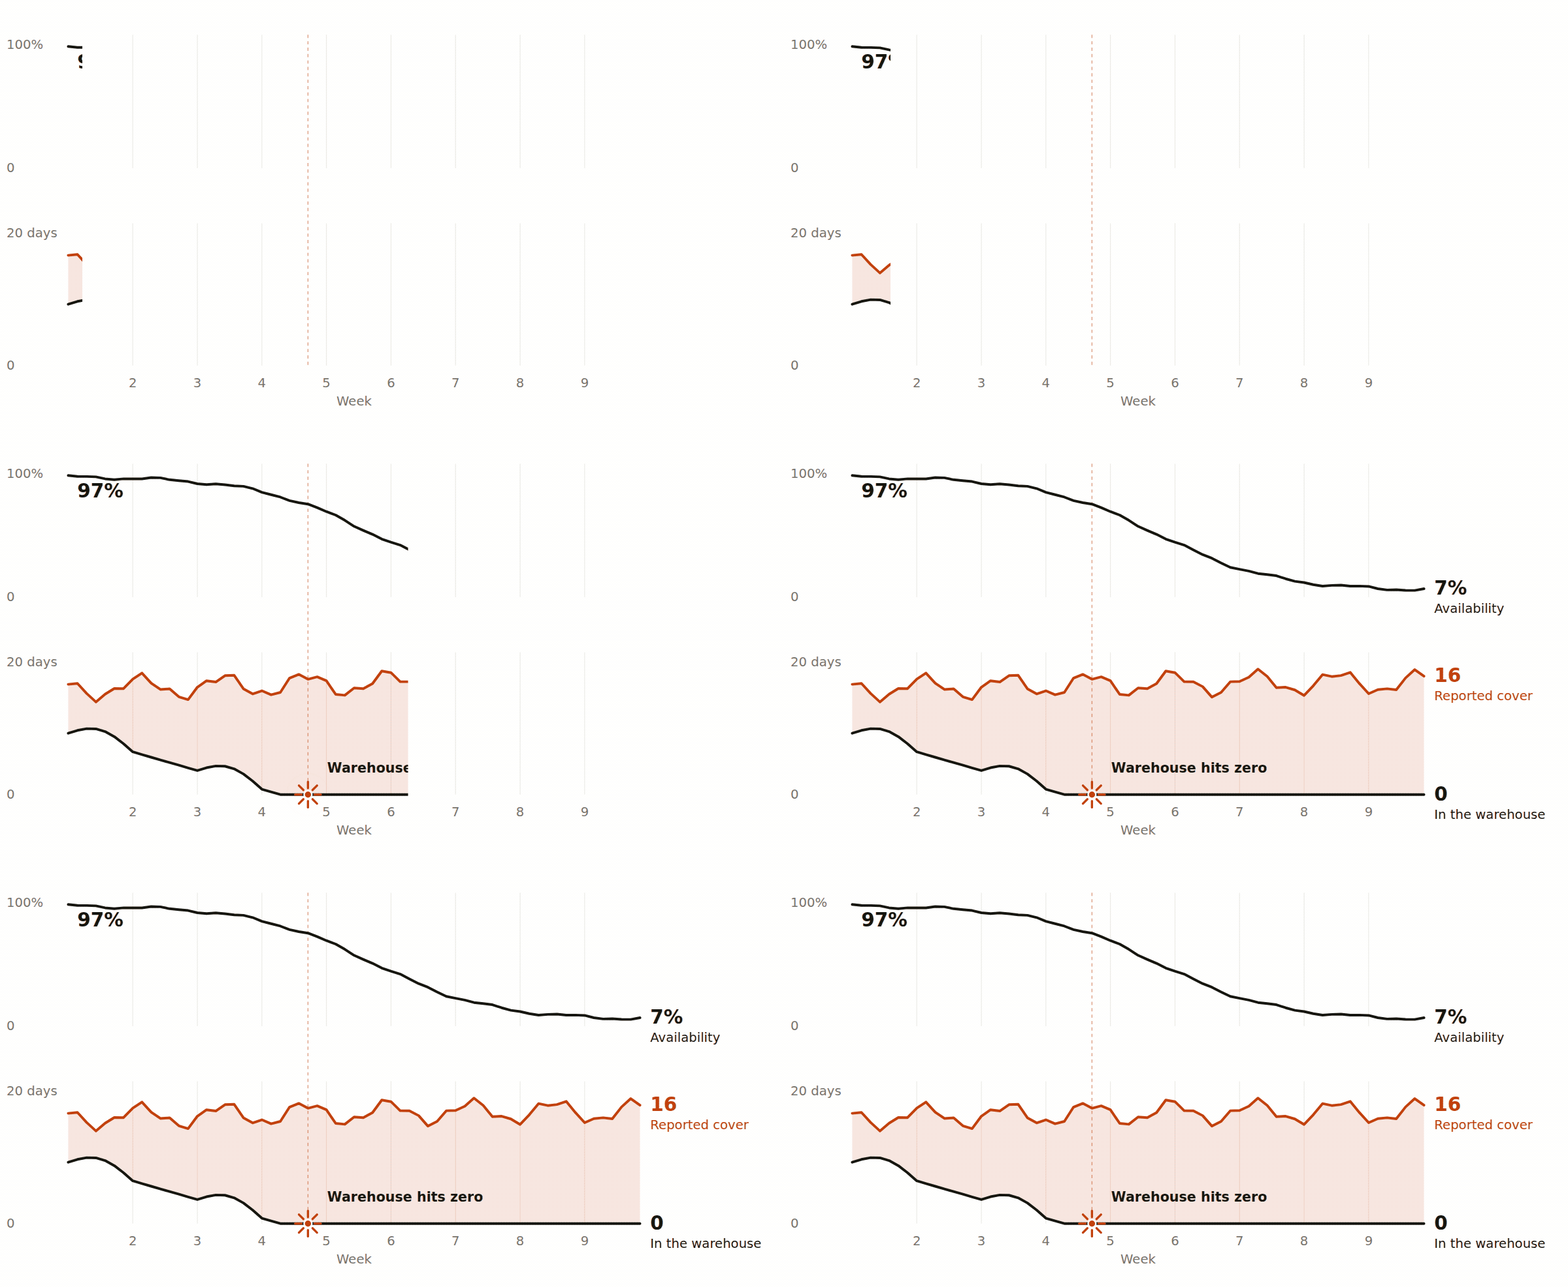
Here is what that looks like over nine weeks. The top line is what customers experienced: session-weighted availability of one high-volume SKU. The pair below it is days of cover, what the system reported against what was actually in the warehouse. The shaded band between them is stock that existed only on paper.
Why nobody gets an alert
Because nothing is technically wrong. Every system is doing its job.
- The replenishment engine sees enough cover, so it suppresses the order. Suppression is silent by design: you get alerted when something fires, not when something is declined. This is the one that should keep you up at night, because a system that can’t tell you what it decided not to do is a system you can’t audit.
- The availability dashboard shows the outcome, not the cause. It’ll tell you the SKU is at 12%. It won’t tell you why.
- The category manager is watching a hundred other SKUs and has no reason to look at this one. On the replenishment screen, it’s green.
- The vendor scorecard is quarterly.
That last one deserves more than a bullet.
A fill rate can go from 95% to 12% in three weeks. A quarterly supplier review finds out about it in twelve. By then you’ve lost the sales, your customers have found the item somewhere else, and the conversation with the vendor is an autopsy instead of an intervention. Quarterly scorecards aren’t governance. They’re theatre with a spreadsheet attached.
Each function has a partial view. The failure lives in the gap between them, which is exactly where nobody is looking.
The conditions that let it hide
The same handful of settings turn a vendor problem into a two-month outage. None of them is a bug. Each was a sensible decision on its own.
- Weekly ordering windows. If POs can only be raised on Mondays and the lead time is ten days, the gap between spotting a stockout and receiving goods is never less than two weeks. Your system can only react once a week. Your customers shop every day.
- In-transit counted at face value. A purchase order raised three days ago and one raised five weeks ago are not the same thing. Most cover calculations can’t tell them apart.
- Minimum order values applied uniformly. A low-volume site facing the same order minimum as a high-volume one gets ordered for less often, and each missed delivery hurts it more. The smallest warehouse goes dark first, every time.
- Forecasts that run a little low. A one-unit-a-day underforecast sounds harmless. On a SKU selling five units a day, over a seven-day cycle, that’s a day and a half of cover. Every cycle. Compounding.
| Question | Replenishment stack today | In Cimba |
|---|---|---|
| What counts as cover | Warehouse stock plus everything on an open PO | Physical stock and inferred stock, read separately |
| Age of in-transit | Not considered | Past the vendor’s lead time, it stops counting |
| Fill rate checked | Quarterly, at the supplier review | Continuously, by vendor and by site |
| When the two disagree | No order is raised, and nothing is logged | Next Best Action, routed to an owner, with the reasoning |
| Who finds out | A store, when a customer asks | The buyer, the day the divergence starts |
What to check this week
You can test for this without changing a thing.
- Pull physical warehouse stock and in-transit as separate columns for your top SKUs. Anywhere physical is zero and cover still reads healthy, you’ve found one.
- Age your in-transit. A purchase order older than the vendor’s lead time isn’t in transit. It’s late. It shouldn’t count as cover.
- Look at fill rate over sixty days instead of over the quarter. A vendor at 12% and a vendor at 95% produce identical-looking cover numbers until you separate them.
If step one turns up nothing, good. Run it again next month.
Where Cimba fits
Cimba reads the production data you already have, continuously: point of sale, inventory, supply chain, ERP, warehouse. Your ERP stays the system of record. Nothing migrates.
What Cimba adds is the reading. It separates physical stock from inferred stock, watches fill rate at the vendor and site level as it moves rather than at quarter end, and when the two diverge it sends the Next Best Action to the person who owns it, with the reasoning and the numbers attached.
It runs all three of the checks above, continuously, across every SKU rather than the ones somebody thought to look at.
Not an alert on a dashboard nobody opened. A specific recommendation, routed to a named owner, logged.
Availability watch · SKU 18237
In the analysis behind this article, that came out as five ranked root causes across three warehouses, each with an owner and the evidence behind it.
It took minutes. The failure it found had been running for two months, with every system involved reporting that everything was fine.
None of this needed new data. Everything required to catch it was already sitting in systems the company was paying for, in the same reports, on the same screens, the whole time. What was missing was somebody reading two numbers side by side every morning and noticing the day they stopped agreeing.
That isn’t a hard job. It’s a relentless one, and it has to happen on every SKU rather than the ones somebody thought to check. Which is a reasonable description of the difference between a dashboard and an agent.
Frequently asked questions
What is phantom inventory?
Phantom inventory is stock a system believes it has but that is not physically there. In grocery and quick commerce the most common cause is not shrink or a counting error, it is unfilled purchase orders that keep counting as stock in transit. The record says goods are on their way, the vendor never shipped them, and nothing in the arithmetic corrects itself.
Why does my system show inventory when the shelf is empty?
Because days of cover usually adds stock in transit to stock on hand, and stock in transit is inferred from open purchase orders rather than measured. If a vendor stops delivering, every new order raises the in-transit figure while the warehouse stays empty, so reported cover can hold steady or even rise during a total stockout.
Should days of cover include in-transit inventory?
Yes, but only in-transit that is still plausible. Goods ordered inside the vendor lead time will realistically arrive and should count. A purchase order older than the lead time has not shipped, and counting it as cover suppresses the reorder that would fix the problem. Ageing in-transit against lead time is the highest-value single change to the calculation.
How can I tell if a purchase order is stale?
Compare the age of the order against the vendor lead time for that item and site. Anything older has missed its delivery window, whatever status the system shows. Pulling open purchase orders sorted by age, with the lead time beside them, surfaces this in a few minutes and requires no change to any system.
How often should vendor fill rate be reviewed?
Continuously, or at least far more often than quarterly. A fill rate can fall from 95 percent to 12 percent inside three weeks, which is long enough to empty a warehouse and short enough that a quarterly supplier review will not see it until the sales are already lost.
Can this be fixed without replacing the replenishment system?
Yes. The failure is in how cover is calculated and how rarely fill rate is checked, not in the system that holds the record. Separating physical stock from inferred stock, discounting stale in-transit, and watching fill rate as it moves can all be done alongside an existing ERP and replenishment stack. The ERP stays the system of record.
Cimba is proactive AI for enterprise business and finance operations. See what it does for retail and marketplace operations.
Schedule your personalized demo
Bring us one week of your data and we’ll show you what Cimba would have flagged, what it would have recommended, and who it would have gone to.